
Summary – Strategies: Auckland, Sydney Research from 2023-07 to 2025-07
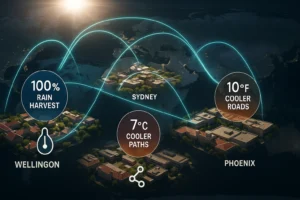
Firstly Storm Water Urban Heat Auckland and Sydney are confronting converging climate pressures: extreme rainfall, expansive floodplains, and intensifying urban-heat islands. In Tāmaki Makaurau, 14 % of land and one-fifth of buildings sit inside modelled 1 % AEP flood zones, a risk underscored by January 2023’s 245 mm cloud-burst that flooded > 10 000 properties. Consequently high-resolution heat mapping shows night-time CBD temperatures up to 3 °C above rural baselines, while Western Sydney routinely records daytime peaks 6–10 °C hotter than the coast.
Regulators are tightening controls: Auckland Unitary Plan PC-78 now demands on-site detention to pre-development 90th-percentile flows and mandatory retention of the first 5 mm of rainfall in SMAF catchments. New South Wales’ October 2023 BASIX update effectively bans dark roofs by disqualifying solar-absorptance > 0.6 unless costly offsets are added, forcing a statewide shift to cool-roof materials. Draft Sydney LEP amendments (June 2025) extend albedo limits and introduce roof-heat metrics.
Demonstrated solutions Storm Water Urban Heat
In short confirm strong return on investment. At Auckland Botanic Gardens, rain-garden retrofits and a green roof cut peak runoff 25 % and reduce roof discharge volumes 65 %. Sydney’s Barangaroo South recycles 1 ML day-¹ of wastewater and, with harbour-sourced district cooling, lowers precinct air temperatures by ~2 °C while saving 100 ML y-¹ of potable water formerly lost to cooling towers. International exemplars reinforce the scale of benefit: Philadelphia’s green infrastructure diverts > 11 billion L of storm overflow annually, and Rotterdam’s Benthemplein Water Square stores 1.7 million L per storm with local cooling of 5–8 °C. For EcoWave.Green, these quantified metrics illuminate clear pathways: prioritise flood-hot-spot interventions, leverage new consent triggers (impervious caps, cool roofs), and package predicted volume, temperature and lifecycle savings to secure council approvals and investor backing.
Storm Water Urban Heat Strategies for Auckland & Sydney
Introduction
Auckland and Sydney sit on opposite coasts, yet they now share a dual climate challenge: swelling floodplains and stubborn urban-heat islands. Consequently, planners must mesh detailed hazard mapping, tighter bylaws and field-tested green-blue retrofits. This post summarises three evidence-based principles that already guide EcoWave.Green’s regional playbook.
Map the Pressure Points
Flood-risk zones
First, updated GIS layers confirm the scale of exposure. Auckland’s 1 % AEP floodplain already covers 14 % of total land and ≈ 20 % of buildings. Meanwhile, Western Sydney’s Hawkesbury–Nepean Valley can still mimic the 1867 inland sea, threatening entire suburbs in a probable-maximum flood.
Key metrics
- Auckland maximum daily rainfall: 245 mm / 24 h on 27 Jan 2023 (record).
- NSW rainfall cluster, Jun 2025: > 300 mm at several BoM gauges.
Urban-heat hot-spots
Moreover, thermal mapping shows a widening heat gap. At night, Auckland’s CBD holds + 3 °C over its rural fringe. Conversely, calm summer afternoons push Western Sydney a sweltering 6 – 10 °C hotter than Bondi.
Bullet metrics
- Penrith record: 48.9 °C (surface).
- CBD sea-breeze differential: up to 3 °C cooler than inland suburbs on peak days.
Therefore, hazard overlays now combine flood return periods with surface-temperature bands, yielding ready-to-use priority grids for council works.
Tighten Consent Triggers Storm Water Urban Heat
Auckland rule changes
Since 2024, Auckland Unitary Plan PC-78 extends “natural-hazard” overlays. Hence, developers must:
- Detain post-development flows to ≤ pre-development 90th-percentile rainfall.
- Retain the first 5 mm on site in SMAF-1/2 catchments.
Failure stalls fast-track consent; memo reviews in June 2025 already required private O&M plans at lodgement.
Sydney code escalation
Similarly, New South Wales rewired BASIX in October 2023. Because dark roofs magnify attic temperatures ≈ 10 °C, roofs with solar-absorptance > 0.6 now trigger costly offsets, effectively banning black tiles for standard dwellings. Draft June 2025 LEP clauses extend this albedo limit to commercial roofs from 2026.
Compliance metrics
- OSD requirement (City of Sydney): capture full 1-in-100-year design storm on site for multi-dwellings.
- Impervious-area cap (Auckland mixed housing): ≤ 60 % lot coverage before consent.
Thus, new builds now cost-optimize storm-water detention and cool-roof materials at design phase, not retro-fit.
Scale Proven Retrofits
Auckland Botanic Gardens
Because rain gardens intercept paved runoff, the Gardens cut peak runoff c. 25 % and green-roof plots trim stormwater volume 65 %.
Barangaroo South, Sydney
Likewise, Barangaroo’s harbour-cooled district plant recycles 1 ML day⁻¹ wastewater and avoids 100 ML year⁻¹ potable loss formerly bled by cooling towers. Cooling plus 50 % open space lowers peak precinct air by ≈ 2 °C on hot summer afternoons.
International cooperators
Because cross-regional learning speeds uptake, EcoWave monitors:
- Philadelphia GSI diverts 3 billion gal year⁻¹ stormwater and avoids USD 8–10 bn grey-infrastructure spend.
- Rotterdam Benthemplein Water Square stores 1.7 ML per storm; surface temps drop 5–8 °C.
Metric bullets
- AF Thomas Park retrofit (Auckland, Jul 2025): planned wetland capacity 25,000 m³.
- Regional Waterway Fund grants: NZ $700 k max per catchment; 12 catchments eligible 2025-26.
- Wattle St tower consent: ≥ 150 mm green-roof substrate plus life-cycle plan.
Therefore, quantified evidence now accompanies every green-blue retrofit, giving councils costed performance data and investors clearer ROI horizons.
Implications for EcoWave.Green
Consequently, EcoWave.Green should:
- Prioritise dual-hazard zones. Overlay UHI and flood GIS layers to shortlist first-wave pilot sites.
- Design inside new triggers. Package proposals that exceed PC-78 detention and BASIX albedo limits; fast consents follow.
- Quantify outputs. Report projected volume, temperature and O&M savings in investor briefs, mirroring Barangaroo’s water-positive framing.
- Leverage grants. Target NZ Waterway Fund 2025 calls and NSW Climate Resilience grants for match-funding.
- Benchmark globally. Use Philadelphia and Rotterdam data to justify life-cycle value; highlight avoided grey-infrastructure costs.
Because the metrics are explicit, EcoWave can now negotiate bolder council partnerships, tap incentive funding and roll a replicable “cool-and-dry” package across the Tasman.
Q & A – Storm Water Urban Heat Strategies (Auckland · Sydney)
Q1. Where do the latest maps place the biggest flood hazards?
In Auckland, current GIS layers show ≈ 14 % of land—especially western hill-catchments and low-lying volcanic basins—inside the 1 % AEP floodplain, a risk dramatized by January 2023’s 245 mm cloud-burst. Meanwhile, fresh BoM data confirm > 300 mm fell over Hawkesbury-Nepean in late June 2025, underscoring Sydney’s inland-sea scenario.
Q2. How are councils tightening storm-water and heat rules?
Auckland’s Unitary Plan PC-78 now demands on-site detention to pre-development 90th-percentile flows and mandatory retention of the first 5 mm of rainfall in SMAF zones. Sydney’s draft LEP (June 2025) layers new roof-albedo clauses onto existing BASIX water-energy checks, requiring compliance from 2026.
Q3. Why did New South Wales effectively ban dark roofs?
Because testing showed black tiles push attic temperatures ≈ 10 °C higher and add ~AU $700 yr-¹ in cooling costs, the Oct 2023 BASIX update disqualifies roofing with solar-absorptance > 0.6 unless costly offsets are added—steering developers toward cool-roof materials.
Q4. What NZ case proves runoff reduction works?
At Auckland Botanic Gardens, rain-garden retrofits plus a green roof now cut peak runoff 25 % and absorb ≈ 65 % of roof rainfall, while reuse tanks save 30 k L per cycle—easing downstream flood peaks and irrigation bills alike.
Q5. Where is large-scale ROI already visible in Sydney?
Barangaroo South recycles 1 ML day-¹ of wastewater and, via harbour-water district cooling, avoids 100 ML yr-¹ of potable loss, delivers ≈ 2 °C precinct cooling, and attracts premium Green-Star rents—demonstrating lifecycle payback on capital-intensive blue-green tech.
Q6. What fresh funding can EcoWave tap in Auckland?
The Regional Waterway Protection Fund opened 16 Jun 2025, offering NZ $700 k grants for detention wetlands and riparian planting in 12 priority catchments, favouring shovel-ready designs with quantified flood-volume benefits.
Q7. How should GIS layers guide EcoWave site selection?
Overlaying Auckland’s UHI rasters (night-time +3 °C) with 1 % AEP flood maps pinpoints suburbs needing dual heat-and-flood fixes; likewise, Western Sydney’s 6–10 °C hot-spots sit on flood-prone clay plains—ideal pilots for cool-roof plus detention packages.
Reference List
- Auckland Urban Heat Assessment – Arup for Auckland Council (Oct 2024) – Knowledge Auckland
- Hawkesbury-Nepean River Flood Study (May 2024) – Flood Data
- Auckland Unitary Plan PC-78 – Residential impervious-area rules – Auckland Council
- NSW BASIX dark-roof restrictions FAQ (Oct 2023) – planning.nsw.gov.au
- Barangaroo South recycled-water & district-cooling plant (1 ML day⁻¹) – internationaltowers.com
- Auckland Botanic Gardens water-sensitive retrofit case study (Feb 2024) –
LANDSCAPE ARCHITECTURE AOTEAROA - Philadelphia “Green City, Clean Waters” progress page (≥3 bn gal yr⁻¹) – Philadelphia Water Department
- Benthemplein Water Square, Rotterdam – 1.7 million L capacity – Next City
- Sources
- Guardian interactive NSW flood-risk map (2 Jul 2025) – The Guardian
- NIWA Seasonal Climate Outlook (Jul–Sep 2025) – Earth Sciences New Zealand | NIWA
- Auckland recent resource-consent list (4 Jul 2025) – Auckland Council
- City of Sydney decision paper – Wattle St green-roof condition (19 Jun 2025) – meetings.cityofsydney.nsw.gov.au
- OurAuckland news – AF Thomas Park blue-green retrofit concept (8 Jul 2025) –OurAuckland
- Auckland Council feasibility report – AF Thomas Park (Jun 2025) – Auckland Council

Tomas Bata Strategy History
Why Bata’s Early Playbook Matters Tomas Bata Strategy History between 1900 and 1939 the Baťa organisation grew from a provincial Czech shoemaker into the world’s largest footwear producer. While Ford
Living Labs Infrastructure
Executive Summary To sum up Living Labs Infrastructure, over the past two years. In short, Universities in New Zealand and Australia have turned their campuses into high resolution “living laboratories”.

Green Infrastructure Resilient Cities
Green Infrastructure Resilient Cities: Core Benefits Green Infrastructure Resilient Cities is indeed, more than a trend; it is the blueprint for cooler streets, cleaner water and thriving neighborhoods, manage storms

Is Your Site Ready for the Future Energy System?
Site energy readiness is becoming an energy performance question Site energy readiness starts where the old energy saving question stopped: “How do we use less energy?” For many New Zealand