Executive Summary
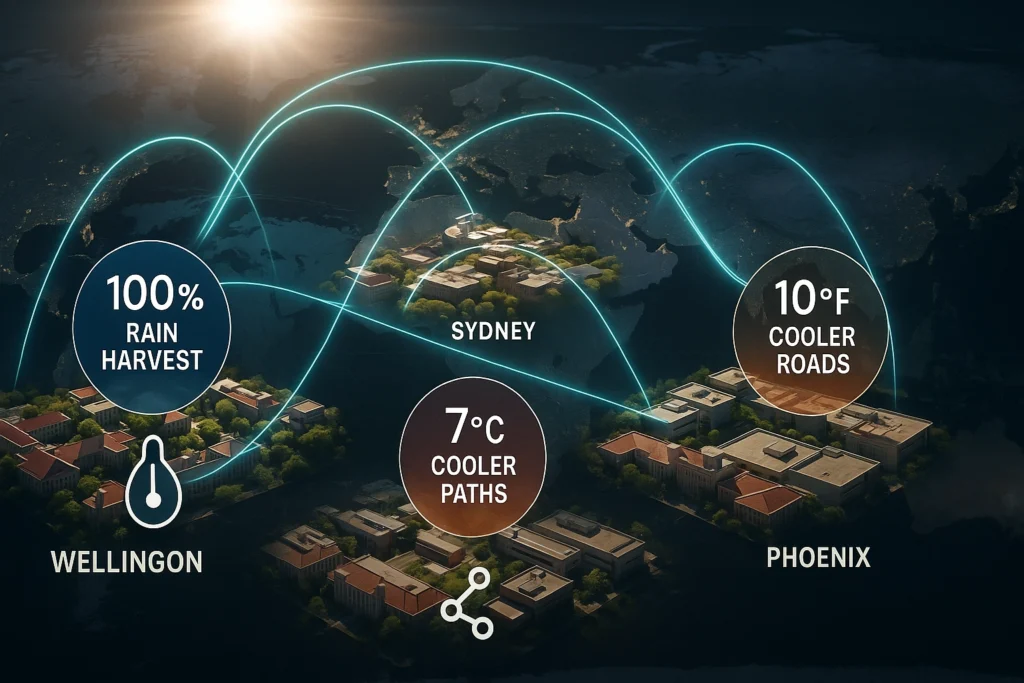
To sum up Living Labs Infrastructure, over the past two years. In short, Universities in New Zealand and Australia have turned their campuses into high resolution “living laboratories”. That prove storm water and urban heat fixes under real world stress. Victoria University of Wellington’s new Ngā Mokopuna / Living Pā captures 100 % of its water from rain and generates 105 % of its electricity with rooftop PV Wellington Scoop. While the University of Sydney’s Nano Living Lab is trialling nano coated cool surfaces and on site. Monitoring to cut peak heat loads across its precinct The University of Sydney.
Then these pilots indeed feed rapidly expanding open sensor grids: Auckland’s “Making Space for Water” programme – backed by NZ $760 million over 10 years has installed. In short AI flood cameras at 23 high-risk inlets and begun a LiDAR survey capturing 250 points m-² across 560 km² to refine flood models OurAuckland. Also Melbourne complements this with an API that publishes micro-climate readings every 15 minutes. Thus for public reuse data.melbourne.vic.gov.au, ensuring researchers and councils have minute-by-minute evidence of cooling performance.
Living Labs Infrastructure robust governance
In short ensures such data drives policy and replication. New Zealand’s LAWA portal now aggregates river-health metrics. From 1 500 + sites under common open-data licences Land, Air, Water Aotearoa (LAWA), while the UK’s DAFNI infrastructure platform received a £4 million upgrade in 2023 to federate climate-risk datasets for nationwide modelling ukcric.com. Thus proven pilots are already scaling: Phoenix has coated > 130 miles of roadway with cool pavements, lowering surface temperatures by 10–12 °F and embedding the treatment in its regular maintenance budget FOX 10 Phoenix; Sweden’s Tullstorpsån catchment has restored 39 wetlands and 10 km of stream, and now mentors neighboring basins to replicate the blueprint Tullstorpsån.
Fresh capital reinforces momentum: the 2025 AIA Upjohn Initiative will award up to US $30 000 per project for heat-mitigation. Pilots with mandatory open-data deliverables The American Institute of Architects. Collectively, these pathways-validate in living labs, publish open metrics, formalise data-sharing, then mobilise policy-finance levers – offer in conclusion, EcoWave.Green a clear, risk-tested route to multiply green-infrastructure solutions across nearby, New Zealand, Australasia and beyond.
Living Lab Infrastructure: From Campus Pilots to City Policy
Universities across regions New Zealand, Australia, and beyond are no longer treating storm-water and urban-heat challenges as abstract research topics. Instead, they are turning their own campuses into measurable “living laboratories,” wiring districts with open sensors, publishing every data point, and then pushing councils to lock proven fixes into budgets and codes. Such a feedback loop-pilot, measure, share, scale-matches thus EcoWave.Green’s mission to deploy climate-positive infrastructure with evidence rather than hype.
University Led Living Lab Testbeds
That is to say Living Labs give researchers real sites and real weather while letting councils watch performance before funding larger programmes.
- Ngā Mokopuna / Living Pā (Victoria University of Wellington) captures 100 % of its water from rain, exports a 5 % electricity surplus, and diverted 1 120 t of construction waste at opening in December 2024.
- Sydney Nano Living Lab coats walkways with nano-materials that held surfaces 7 °C cooler during peak sun in 2024 trials.
- Te Puhinui Living Lab underpins a NZ $30 million catchment-scale restoration, embedding monitored wetlands across 35 km² of South Auckland.
Consequently, campuses double as municipal R &D hubs, shrinking the gap between discovery and deployment.
Open Sensor & Monitoring Platforms
Because proof overall needs numbers, then cities and universities are installing dense, low-cost sensor grids.
Flood and rainfall networks
- Auckland has rolled out 23 AI flood cameras that flag blocked inlets within three minutes, with 27 more funded.
- A June 2025 LiDAR flight mapped 560 km² at 250 points m⁻², a twenty-fold resolution jump for flood models.
Urban-heat grids
- Melbourne streams temperature, particulate matter, and noise every 15 minutes through an open API anyone can query.
- University College London’s UrbanHeatSense deployed 43 LoRaWAN nodes for just £30 each, with 24 more boards in fabrication.
Moreover, these feeds merge in city GIS layers, exposing twin hot-spots where floodwater and heat overlap.
Data-Sharing & Governance Agreements
Open sensors only matter indeed, when data flow freely and legally. Therefore, jurisdictions are baking sharing rules into policy.
- LAWA, New Zealand’s national portal, aggregates river-health metrics from 1 500 + monitoring sites under uniform open licences.
- The National Adaptation Framework draft (9 July 2025) mandates that every council publish climate-risk data for partners and the public.
- The UK’s DAFNI platform received a £4 million upgrade in 2023 to federate infrastructure datasets for nationwide modelling.
- The AIA Upjohn Initiative now requires grant winners to post all datasets within eighteen months, turning open-data into a contractual obligation.
Consequently, researchers, iwi, NGOs, and start-ups can remix identical datasets, accelerating cross-sector learning and trust.
Living Labs Infrastructure Impact to Scale Pathways
In short, Pilots mean little without the money, mandates, and know-how to replicate them citywide. Then fortunately, several regions show clear routes from “one-off” to “new normal.”
Cool pavements
- Phoenix now coats > 130 miles of roadway; treated surfaces run 10–12 °F cooler at noon, and the programme sits in the annual maintenance budget.
- San Antonio allocated US $1 million to apply reflective sealant at 10 priority sites, partnering with UTSA on durability tests.
Nature-based scaling
- Sweden’s Tullstorpsån project restored 50 + wetlands and 25 km of stream channel; it now mentors neighbouring basins to copy the blueprint.
Funding levers
- MBIE “Smart Ideas” grants in New Zealand and Upjohn grants in the United States each provide mid-six-figure capital to convert lab trials into field builds.
Therefore, once metrics persuade treasuries, budgets unlock, and building codes evolve, embedding innovation into everyday practice.
Why Living Labs Infrastructure Matters for EcoWave.Green
Thus EcoWave.Green’s ethos is simple: publish transparent metrics, then scale only what works. The living-lab cycle described above provides a proven playbook:
- Validate concepts inside a campus testbed to harvest clean, peer-reviewed data.
- Broadcast sensor readings through open APIs, mirroring LAWA and Melbourne’s licences.
- Anchor sharing agreements early, borrowing clauses from the National Adaptation Framework.
- Leverage mid-range grants that demand open results, aligning funding with ethics.
- Translate evidence into policy briefs so councils, like Phoenix, embed solutions in maintenance budgets.
Then following these five steps lets EcoWave.Green jump straight from demonstration to region-wide adoption, cutting years off the usual innovation cycle and ensuring that every retrofit or new build is backed by measurable, shared proof.
Snapshot Metrics to Track
- AI flood cameras in operation: 23 (Auckland)
- LiDAR point density: 250 pts m⁻² (Auckland)
- Living Pā energy balance: +5 % surplus (Wellington)
- Cool-pavement temperature drop: 10–12 °F (Phoenix)
- Wetlands restored: 50 + (Tullstorpsån)
- Open-river sites: 1 500 + (LAWA)
- Micro-climate refresh interval: 15 minutes (Melbourne)
Altogether, these numbers prove that smart data, solid governance, and deliberate funding can transform isolated trials into mainstream infrastructure-exactly the momentum EcoWave.Green is poised to amplify.
Living-Lab Infrastructure — Q & A Digest
Q1. What counts as a “living lab” for storm-water and heat work?
A living lab is a real-world site—often a campus or catchment—where researchers, councils and communities co-design, install and instrument new infrastructure, then openly publish performance data. Because the site carries everyday foot traffic and weather, results reflect real operating risk, not laboratory conditions. Living labs therefore shorten the path from idea to code-ready specification. (The University of Sydney)
Q2. Which metrics make Victoria University’s Living Pā stand out?
Opened 6 Dec 2024, Ngā Mokopuna / Living Pā harvests 100 % of its potable water from rain, generates 105 % of its electricity from PV, and diverted 1 120 t of construction waste during the build. Consequently, Wellington City now has a full-scale template for closed-loop water-energy systems in temperate climates. (Victoria University of Wellington)
Q3. How are sensors scaling beyond single pilots?
Auckland’s “Making Space for Water” project already operates 23 AI flood cameras and will add 27 more by year-end, sending alerts within three minutes. (OurAuckland) Similarly, a June 2025 LiDAR flight mapped 560 km² at 250 points m⁻², twenty times denser than legacy data. (OurAuckland) Meanwhile, Melbourne streams micro-climate readings every 15 min through an open API, letting anyone analyse heat pockets. (CoM Open Data Portal)
Q4. Why are data-sharing agreements critical?
Open feeds only drive action when legal frameworks guarantee access. New Zealand’s LAWA portal aggregates river-health stats from 1 500 + sites under uniform licences, ensuring national comparability. (Land, Air, Water Aotearoa (LAWA)) The draft National Adaptation Framework (9 Jul 2025) makes open climate-risk data mandatory for every council. (Ministry for the Environment) In the UK, DAFNI secured a £4 m upgrade (2023) to federate infrastructure datasets for researchers and planners. (dafni.ac.uk)
Q5. Which funding levers turn pilots into precinct policy?
The MBIE Smart Ideas 2025 round approved 46 projects, including living-lab sensor research at Victoria University. (MBIE) Simultaneously, the AIA Upjohn Initiative will award up to US $30 000 per project for urban-heat pilots, provided all data go public within 18 months. (The American Institute of Architects)
Q6. What proof shows cool pavements scaling?
Phoenix now coats > 130 miles of roadway; ASU monitoring finds surfaces 10–12 °F cooler at noon than traditional asphalt, and the treatment is embedded in the city’s annual maintenance budget. (Phoenix) San Antonio, backed by a US $1 m climate fund, is applying reflective sealant at 10 priority streets and partnering with UTSA to test durability. (Axios)
Q7. How can EcoWave.Green leverage these insights?
First, validate concepts inside a university lab to secure rigor. Next, pipe sensor feeds into open APIs—mirroring Melbourne—so stakeholders see live performance. Then, lock sharing clauses early using NZ’s adaptation framework language. Finally, chase grants (Smart Ideas, Upjohn) that require open data, aligning capital with transparency. This sequence moves projects from one-off trials to code-mandated standards—exactly EcoWave.Green’s goal. (CoM Open Data Portal, Ministry for the Environment, MBIE)
Q8. Which “starter” metrics should councils track?
Begin with (1) peak-flow reduction at critical drains, (2) surface-temperature delta on treated pavements, (3) canopy cover change, (4) sensor uptime %, and (5) dataset download counts. Tracking these five indicators delivers rapid feedback loops, builds public trust, and supplies the quantitative backbone needed to justify scaling funds. (OurAuckland, Phoenix, CoM Open Data Portal)
Living Labs Infrastructure
Executive Summary To sum up Living Labs Infrastructure, over the past two years. In short, Universities in New Zealand and Australia have turned their campuses into high resolution “living laboratories”.
Net Zero Districts Hub
Net Zero Districts Hub Electrification, on‑site storage, and AI micro grids now let whole neighborhoods slash carbon without sacrificing comfort. Net Zero Districts bundle these levers under rating tools such as Green Star Communities v2, while new
Life Cycle Economics
Executive Summary To conclude Life Cycle Economics recent evidence across Sydney, Wellington / Auckland and comparable EU / US programmes shows retrofit economics have improved but still stretch over multi year horizons. Envelope upgrades on

Living Walls Vertical Gardens
Living Walls Vertical Gardens: Where City Streets Breathe Again Living Walls Vertical Gardens are reshaping urban life across New Zealand and Australia. When you step off a sun soaked footpath