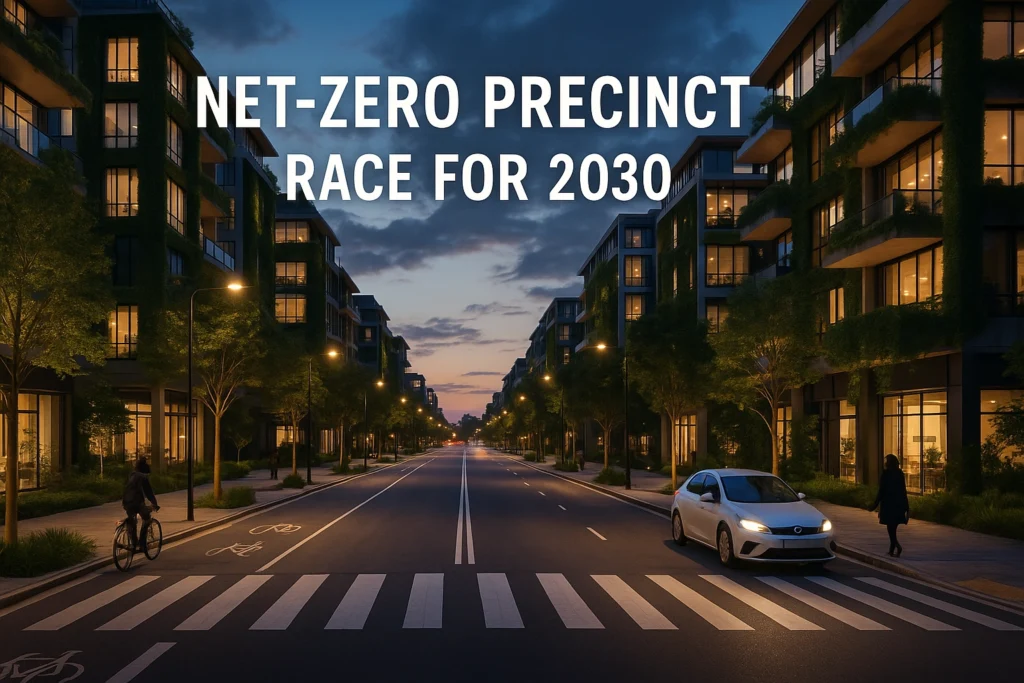
Executive Summary
Net-Zero Precinct Programs On 2 July 2025 the City of Sydney released its Environmental Strategy 2025-2030, hard-coding an all-electric pathway and a 2035 net-zero target. Local-environment-plan amendments already oblige major CBD projects lodged after 2026 to prove scope 1 + 2 neutrality, a shift forecast to save owners A$1.3 billion in lifetime energy costs. Council operations have meanwhile cut emissions to 12 554 t CO₂-e in FY 2023/24, 76 % below 2006 levels. Draft NCC 2025 clauses cap resistive heating at 40 W/m², mandate electrification-ready switchboards and coincide with a July-2025 ban on high-GWP VRF systems, steering designs toward heat-pump HVAC and lower cooling loads. Together, these policy levers make every new Sydney precinct a real-time net-zero laboratory whose quantified energy, heating and cooling thresholds EcoWave.Green can model from day one.
Market rating tools translate policy into investable KPIs: Green Star – Communities awards full points only when precincts trap ≥ 90 % TSS and reach 20–30 % tree canopy or cool-roof coverage, while a July-2025 NABERS update tightens energy baselines by ~15 %. Globally, the EU’s SET-Plan backs 100 Positive-Energy Districts by 2025, with Vienna’s Zukunftsquartier designed to export annual surplus heat and power. In the US, Denver’s National Western Center will cover ≈ 90 % of thermal demand via a 3.8 MW sewer-heat loop; Washington’s SW EcoDistrict retains the 1.2-inch storm on-site, and Philadelphia’s Green City, Clean Waters diverts 3 billion gal/yr of runoff. New York’s Cool Neighborhoods programme shows cool roofs and pavements cutting surface temperatures by ≈ 6 °C and trimming AC peaks up to 30 %.
By integrating these numeric success metrics—heating-load caps, runoff volumes, canopy targets and energy-export ratios—EcoWave.Green can benchmark any client precinct against both Australian codes and world-class net-zero exemplars, delivering data-grounded advice that de-risks design decisions and accelerates climate-positive outcomes.
Sydney’s Net-Zero Precinct Playbook: Turning Policy into Measurable Climate Gains
Net-Zero Precinct Programs although Sydney’s climate ambitions are bold, the city is pairing aspirational slogans with hard numbers—and the figures matter. Consequently, EcoWave.Green can now guide clients through a data-rich roadmap that aligns local requirements with proven global precedents. Meanwhile, fresh NCC rules, sharper certification KPIs, and district-level breakthroughs overseas show exactly how storm-water reuse and urban-heat relief convert into carbon cuts. Therefore, the following playbook distils essential metrics and lessons for any team designing net-zero precincts across Australasia.
Sustainable Sydney 2030—From Vision to Mandate
However, Sydney’s latest Environmental Strategy 2025-2030 moves beyond rhetoric by legislating all-electric developments after 2027. Moreover, 2023 amendments to the Local Environmental Plan require net-zero scope 1 + 2 for large CBD projects lodged post-2026.
Key Metrics
- Emissions from council operations: 12 554 t CO₂-e in FY 2023/24 (-76 % vs 2006).
- Private-sector energy savings forecast: A$ 1.3 billion over asset life.
- Urban-heat programme: 200 heat sensors deployed; 50 % canopy goal by 2030.
Thus precinct designers now face quantifiable obligations: prove neutrality, ban fossil gas, and document canopy expansion.
NCC 2025—Cooling-Load Caps & Electrification Ready
Meanwhile, Australia’s draft NCC 2025 tightens Section J. Consequently, electric resistance heating is only allowed when loads stay ≤ 40 W/m²; otherwise, heat pumps are mandatory. Furthermore, Clause J6D10 compels switchboards to reserve spare capacity equal to any installed gas load, ensuring future electrification.
Bullet Metrics
- Fan-power ratio maximum: 1.5 W/L·s (draft, Jul 2025).
- High-GWP VRF ban effective 1 Jul 2025—forcing low-GWP refrigerants.
Therefore, every new precinct must account for stricter cooling metrics and electrical infrastructure from day one.
Certification KPIs—Green Star & NABERS Raise the Bar
Moreover, Green Star – Communities v2 links ratings to storm-water and heat-island thresholds. Additionally, July 2025 NABERS precinct updates tighten energy baselines by about 15 %.
Required Benchmarks for 6-Star Precincts
- ≥ 90 % total suspended solids (TSS) removal.
- 70 % total phosphorus (TP) removal.
- 20 – 30 % tree-canopy cover or cool-roof/high-SRI surfaces on ≥ 75 % of roofs and pavements.
Consequently, rating tools translate policy into market signals: investors now expect these metrics in bid documents.
Global Inspiration—District-Level Proof Points
EU Positive-Energy Districts
Furthermore, the EU’s SET-Plan targets 100 Positive Energy Districts by 2025. Vienna’s Zukunftsquartier will export net surplus heat and power annually through low-temperature loops.
US Eco-Districts
Similarly, Denver’s National Western Center will satisfy ≈ 90 % of heating-cooling demand via a 3.8 MW sewer-heat loop. Philadelphia’s Green City, Clean Waters diverts ≈ 3 billion gal/year of runoff. Meanwhile, Washington’s SW EcoDistrict captures the 1.2-inch storm on-site—3.8 million gal of retention. Finally, New York’s Cool Neighborhoods cool-roof coatings drop surface temps ≈ 6 °C, trimming AC peaks up to 30 %.
Thus district precedents confirm that integrated energy-water-heat solutions can achieve verifiable carbon and resilience gains.
Net-Zero Precinct Programs Takeaways for EcoWave.Green
Consequently, EcoWave.Green can synthesize these numeric targets into a practical advisor toolkit:
- Model compliance with Sydney’s 40 W/m² heating cap and electrification-ready clauses.
- Benchmark designs against Green Star’s 90 % TSS and 30 % canopy thresholds before council lodgement.
- Simulate district loops that mimic EU PED or Denver sewer-heat efficiencies, forecasting CO₂ and cost savings.
- De-risk projects by aligning storm-water retention to Washington’s 1.2-inch standard and heat-mitigation to NYC cool-roof performance.
Therefore, project teams receive clear numeric guardrails, proven ROI narratives, and credible international analogues—accelerating confident delivery of net-zero precincts across Australasia.
Q & A – Net-Zero Precinct Programs
Q1. What headline mandate did Sydney lock in on 2 July 2025?
The final Environmental Strategy 2025-2030 requires every new large development to be all-electric after 2027 and to demonstrate scope 1 + 2 net-zero compliance when lodged after 2026, a policy expected to save owners A \$1.3 billion in lifetime energy and accelerate the citywide 2035 target.
Q 2. How will NCC 2025’s cooling-load cap reshape building services?
Draft Section J allows electric resistance heating only where design loads stay ≤ 40 W/m²; otherwise, designers must specify heat-pump HVAC. Moreover, Clause J6D10 obliges switchboards to hold spare capacity equal to any installed gas load, ensuring painless future electrification.
Q 3. Which storm-water metrics must a 6-Star Green Star community hit?
Green Star – Communities v2 awards full credit only when storm-water devices remove ≥ 90 % total suspended solids, 70 % total phosphorus and keep post-development two-year flow peaks at, or below, pre-development levels—-turning detention basins, bio filters and rain gardens into mandatory features.
Q 4. Why does canopy cover matter for heat-island points?
Because 6-Star precincts must show 20–30 % tree-canopy cover or else coat ≥ 75 % of roofs and pavements with high-SRI “cool” finishes; either pathway can lower local peak air temperatures by up to 3–4 °C, improving outdoor comfort and cutting AC demand.
Q 5. What fresh twist does NABERS add in July 2025?
NABERS will tighten precinct energy baselines roughly 15 % to reflect greener-grid emission factors; consequently, master-planners must harvest more on-site renewable or push deeper efficiency to hit a 5-Star-plus precinct rating.
Q 6. Which EU district proves positive-energy is achievable?
Vienna’s Zukunftsquartier—part of the EU goal for 100 Positive Energy Districts by 2025—will export annual surplus heat and power via a low-temperature loop, demonstrating that tight morphology, rooftop PV and seasonal storage can flip the precinct energy balance.
Q 7. How does Denver’s National Western Center slash thermal emissions?
The 250-acre campus is installing a 3.8 MW sewer-heat recovery plant expected to deliver ≈ 90 % of its heating and cooling, thereby avoiding roughly 2 600 t CO₂ per year while freeing roof space for solar generation.
Q 8. How can EcoWave.Green turn these numbers into client value?
By embedding each cited metric—40 W/m² caps, 90 % TSS removal, 30 % canopy, 3.8 MW thermal reuse—into its advisory engine, EcoWave.Green can benchmark design options, simulate compliance costs, and present evidence-rich scenarios that de-risk approvals while aligning precincts with world-class net-zero exemplars.
Reference List
- Council operational emissions, Reduction from 2006 baseline, Net-zero planning controls (offices/hotels/malls), Forecast private energy savings City of Sydney
- All-electric mandate, City of Sydney, News.com.au
- Total Suspended Solids (TSS), Total Phosphorus (TP), Peak 2-yr ARI flow, Tree-canopy (or cool surfaces), Green Building Council of Australia
- NABERS precinct energy baseline, nabers.gov.au
Read More:
Net-Zero Precinct Analysis >>>
Net Zero Districts Hub >>>
Research Hub >>>
Policy Funding Levers >>>

Heating Standard
Why Heating Matters for a Healthy Home Keeping your home warm isn’t just about comfort it’s about health.The World Health Organization recommends a minimum indoor temperature of 18 °C to

Local Energy Savings Are Moving Beyond Advice
Local energy savings are moving beyond advice Local energy savings used to be discussed as good habits: switch equipment off, buy efficient products, reduce waste. Those actions still matter, but
Why Energy Savings Should Start With Losses, Not New Technology
Energy savings start with losses, not technology Energy savings start with losses, yet many organisations still begin by asking what technology they should buy: solar, batteries, heat pumps, new HVAC

Green living Rooftops Gardens
Green living Rooftops Gardens revolutions: how plants are rewriting our city skylines Green living Rooftops Gardens are turning forgotten roofs into not only … but also vibrant habitats that cool