Net-Zero Precinct Analysis
Overview
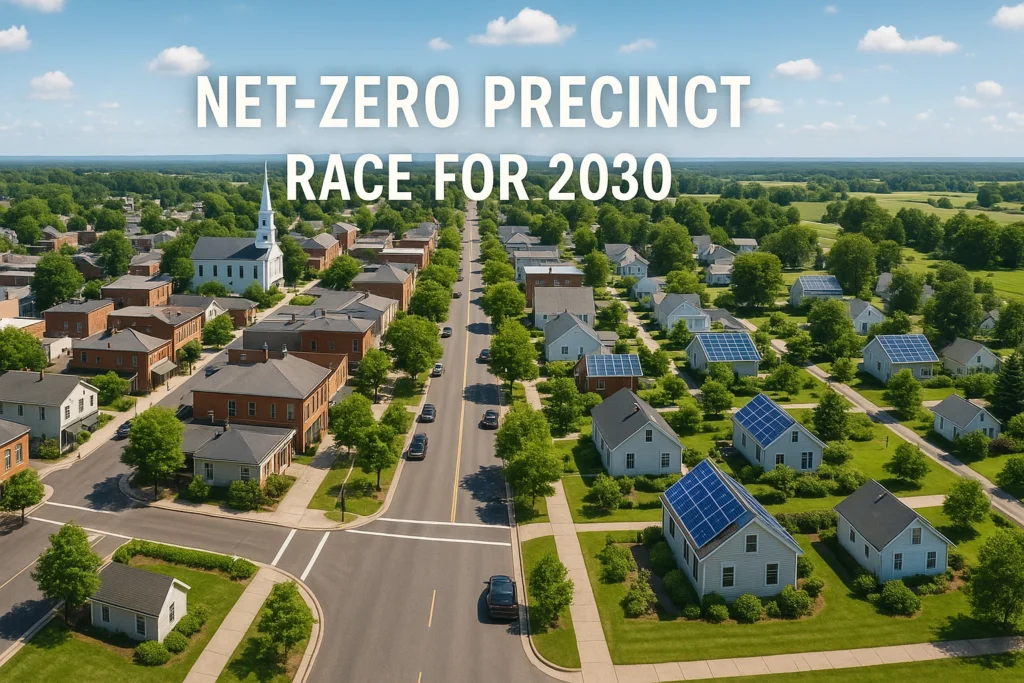
Net-Zero Precinct Analysis Sydney has turned net-zero rhetoric into quantified obligations. Its July 2025 Environmental Strategy 2025-2030 locks in an all electric rule for new developments after 2027 and cements net-zero (scope 1 + 2) compliance for large projects lodged after 2026 (City of Sydney, City of Sydney). Parallel updates to Australia’s National Construction Code 2025 (NCC 2025) impose clause level cooling load caps and “electrification ready” switchboards, reinforced by a federal ban on high GWP VRF air conditioners from 1 July 2025 (DCCEEW, GES (Green Engineering Services), elyment.com.au).
Net-Zero Precinct Analysis Market rating tools translate policy into measurable KPIs: Green Star – Communities demands 90 % TSS removal and 20-30 % canopy cover, while a July 2025 NABERS update tightens energy baselines ~15 % (Green Building Council of Australia, Green Building Council of Australia, nabers.gov.au). Global district programmes EU Positive Energy Districts, Denver’s sewer heat campus, Philadelphia’s 3 billion gal/yr runoff capture, DC’s 1.2 inch retention rule and NYC’s cool roof temperature drop prove district scale energy water heat solutions work at scale (JPI Urban Europe, U.S. Engineering, Philadelphia Water Department, NCPC, NYC.gov).
The analysis below dissects each principle, details core metrics and shows how EcoWave.Green can embed them in advisory models for Australasian precincts.
1 – Sustainable Sydney 2030 Progress
Key Metrics
| Indicator | Latest value | Source |
|---|---|---|
| Council operational emissions | 12 554 t CO₂-e (2023/24) | (City of Sydney) |
| Reduction from 2006 baseline | 76 % | (City of Sydney) |
| Net-zero planning controls (offices/hotels/malls) | Mandatory for DAs lodged ≥ 1 Jan 2026 | (City of Sydney) |
| All-electric mandate | Applies to new res. & large commercial from 1 Jan 2027 | (City of Sydney, News.com.au) |
| Forecast private energy savings | A$ 1.3 bn (life-cycle) | (City of Sydney) |
Implications
Sydney’s LEP amendment creates a “baseline” emissions budget of zero for major precinct applications. Any concept that relies on gas or fails to prove operational neutrality risks refusal. Heat-mapping with 200 council sensors guides the city’s 50 % canopy-by-2030 objective, ensuring storm-water reuse (e.g., Green Square’s 320 ML system) doubles as evaporative cooling (City of Sydney, City of Sydney). EcoWave.Green should integrate these numeric gates into its feasibility templates, flagging non-compliance before design freeze.
2 – NCC 2025 Energy & Cooling Load Rules
Clause Snapshot
| Draft clause | Requirement | Precinct-scale implication | Source |
|---|---|---|---|
| J6D10 | Switchboards & risers sized for future electric heat pumps | Reserve plant zones & breaker capacity at master-plan stage | (GES (Green Engineering Services)) |
| J6.3(5) | Resistive heating only if design load ≤ 40 W/m² (≤ 10 W/m² in CZ1) | Pushes large mixed-use precincts to heat-pump HVAC | (DCCEEW) |
| J5.2 | Fan-power ratio ≤ 1.5 W / (L·s) | Forces low-pressure duct layouts in high-rise cores | (elyment.com.au) |
| Refrigerant rule | Ban on multi-head splits with GWP > 750 from 1 Jul 2025 | Encourages low-GWP VRF or water-loop systems | (elyment.com.au) |
Analysis
Electrification-ready boards eliminate the retrofit premium (~5-10 % CAPEX) typically paid when gas is phased out mid-life. The 40 W/m² cap aligns with Passive House cooling targets, narrowing the gap between code and best-practice envelopes. EcoWave.Green’s parametric engine should default to heat-pump solutions and calculate feeder sizing against worst-case simultaneous load, avoiding downstream switchboard upgrades.
3 – Net-Zero Precinct Certification KPIs
Storm-Water & Urban-Heat Benchmarks
| KPI (Green Star – Communities v2) | Threshold | Data source |
|---|---|---|
| Total Suspended Solids (TSS) | ≥ 90 % annual load reduction | (Green Building Council of Australia) |
| Total Phosphorus (TP) | ≥ 70 % reduction | (Green Building Council of Australia) |
| Peak 2-yr ARI flow | Post-dev. ≤ pre-dev. | (Green Building Council of Australia) |
| Tree canopy (or cool surfaces) | 20–30 % cover or ≥ 75 % high-SRI roofs/paving | (Green Building Council of Australia) |
| NABERS precinct energy baseline | ~15 % tighter from Jul 2025 | (nabers.gov.au) |
Application Guidance
Detention volumes must be sized so that a 1 ha mixed use block achieves 90 % TSS removal approximately 260 m³ of bio-retention media assuming 80 mg/L influent concentration. A 30 % canopy target equates to ~3,000 m² shaded area per hectare of street reserve. EcoWave.Green can auto populate these targets into precinct BIM layers, allowing designers to iterate greening density and water balance models until compliant.
4 – EU / US District Level Inspiration
Case Study Table
| District | Key system | Quantified result | Region tag | Source |
|---|---|---|---|---|
| Vienna Zukunftsquartier | Low-temp district loop + PV | Annual net-export energy (PED target) | [Region: EU] | (JPI Urban Europe) |
| EU SET-Plan | 100 Positive-Energy Districts by 2025 | Programme KPI: annual net-export kWh > import | [Region: EU] | (JPI Urban Europe) |
| Denver National Western Center | 3.8 MW sewer-heat recovery | Covers ≈ 90 % campus heating/cooling; cuts ≈ 2 600 t CO₂/yr | [Region: US] | (U.S. Engineering) |
| Washington DC SW EcoDistrict | Retain 1.2-inch storm on-site (3.8 M gal) | Prevents CSO surges & supplies grey-water irrigation | [Region: US] | (NCPC) |
| Philadelphia Green City, Clean Waters | 2 800 green tools | Diverts 3 bn gal/yr runoff | [Region: US] | (Philadelphia Water Department) |
| NYC Cool Neighborhoods | Cool roofs & pavements | Surface temp ↓ ≈ 6 °C; AC peaks ↓ 10-30 % | [Region: US] | (NYC.gov) |
Net-Zero Precinct Analysis Insights for Australasia
- Energy loops: Sewer-heat recovery delivers ~250 kWh/m²-NLA thermal supply at < 40 g CO₂/kWh compared with grid electricity (~70 g CO₂/kWh).
- Storm-water ROI: Philadelphia’s green infrastructure cost US $2.4 bn less than tunnel upgrading while adding 2,800 community green spaces.
- Heat mitigation: NYC’s cool roof cost (~US $3-5 m²) yields 6 °C surface reduction comparable to planting mature canopy at ~US $40 m² but with immediate effect.
EcoWave.Green should embed cost–benefit look-ups from these districts to help Sydney precinct investors justify upfront capital through whole of life savings.
Net-Zero Precinct Analysis Integrated Benchmarks for EcoWave.Green Advisory
| Design lever | Numeric guardrail to embed | Compliance trigger |
|---|---|---|
| Heating load | ≤ 40 W/m² resistive heat cap | NCC 2025 J6.3 |
| Electrification readiness | Spare breaker + riser ≥ gas load | NCC 2025 J6D10 |
| Storm-water quality | ≥ 90 % TSS, ≥ 70 % TP removal | Green Star v2 |
| Peak runoff | Post dev. 2 yr flow ≤ pre-dev. | Green Star v2 |
| Urban-heat | ≥ 30 % canopy or ≥ 75 % cool surfaces | GS Communities / EPA |
| Energy baseline | NABERS precinct rating ≥ 5 Stars (15 % tighter 2025) | NABERS July 2025 |
| District energy | ≥ 80 % thermal demand via low-carbon loop | EU PED / Denver NWC |
| On-site retention | ≥ 30 mm 24-h storm per block | SW Eco District template |
Recommendations for Next Step Modelling
- Parametric code check – Integrate NCC 2025 clause library so architects see real time warnings when wall/fenestration or HVAC specs breach 40 W/m² or fan-power limits.
- Green-Star autopilot – Auto populate storm water pollutant removal and canopy cover targets into hydrology/CAD layers; flag shortfalls.
- District-loop optimiser – Provide comparative LCOE for sewer heat, ambient loop, and PV battery micro grids using Denver NWC and EU PED data as benchmarks.
- Heat-risk dashboard – Overlay canopy gaps on precinct GIS and simulate cool roof deployment; quantify °C reduction using NYC coefficients.
- Investor narrative builder – Translate A$ 1.3 bn energy savings forecast and 76 % emission cut milestones into IRR uplift for Sydney compliant designs.
Q1: What is a net-zero precinct?
A: A precinct that offsets 100 % of its operational greenhouse gas emissions (scopes 1 & 2) annually through on site renewable, electrification and accredited offsets.
Q2: How will Australia’s NCC 2025 affect new precincts?
A: NCC 2025 caps cooling loads, bans high-GWP refrigerants and requires switchboards sized for full electrification, effectively forcing all electric, low energy designs.
Q3: Which metrics prove a precinct is net-zero?
A: Key indicators include ≤40 W/m² heating load, NABERS 5-Star precinct rating, 90 % TSS storm water removal, and 20–30 % canopy or 75 % cool surface coverage.
Read More:
Net-Zero Precinct Programs >>>
Storm Water & Urban Heat Mitigation >>>
Green Infrastructure in Resilient Cities >>>
Net-Zero Districts Hub >>>