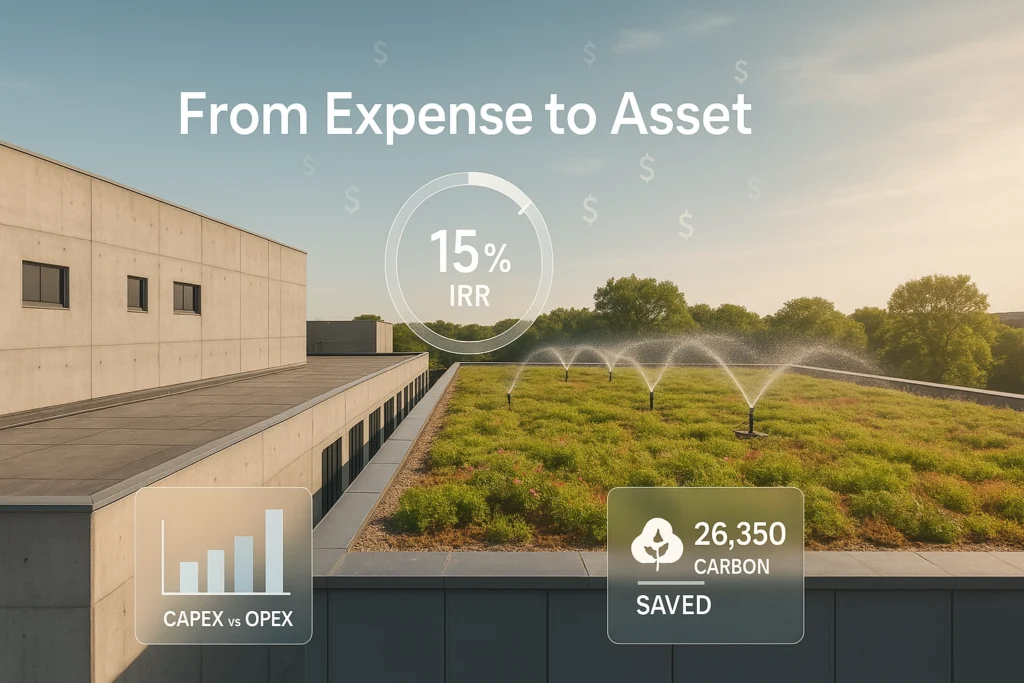
In summary Life Cycle Economics Hub lets boards see a project’s whole cash journey, not just its first invoice. It splits capital and operating outlays, draws NPV curves with today’s risk‑free rates, and then swings each curve through Monte‑Carlo clouds. Consequently, confidence replaces guesswork. In Auckland, 40 000 LED street‑lights repay in eight years and save NZ $36 million. Over twenty years Carbon and Energy Professionals. Likewise, Melbourne modelling shows low‑rise green roofs still beat a 15 % IRR hurdle participate.melbourne.vic.gov.au. With New Zealand’s 2025 Investment Boost offering 20 % up front depreciation, paybacks shorten further Inland Revenue.
Life Cycle Economics Hub what it covers
In short Life cycle Economics follows five clear steps. First, it separates CAPEX and OPEX. Auckland Council’s fair funding tables add NZ $3.7 million operating and NZ $3.5 million capital for Albert‑Eden in 2025/26, showing a 51 : 49 split Auckland Council. Second, it prices those streams with Treasury’s 30 June 2025 risk‑free schedule; the 2036 spot rate is 4.77 % The Treasury New Zealand. Third, it runs discount‑rate sensitivity, moving from 3 % social rates to 7 % capital‑market rates. Fourth, it quantifies uncertainty: Treasury guidance mandates Monte Carlo, analysis for major business cases The Treasury New Zealand. Finally, it delivers color‑coded risk scores, break even charts and IRR ladders ready for board papers.
Why it matters
Afterward numeric proof convinces stakeholders.
- LED retrofit: Stage 1’s 11.2 GWh annual saving trims NZ $1.7 million energy bills and NZ $1.2 million maintenance each year Auckland Transport.
- Payback: The same LED roll-out reaches cash break-even in year 8, and nets NZ $36 million present value Carbon and Energy Professionals.
- Green roofs: Melbourne’s low‑rise commercial case still clears a 16 % feasibility threshold, comfortably above the 15 % target IRR participate.melbourne.vic.gov.au.
- Green‑debt premium: Australia’s inaugural sovereign Green Treasury Bond priced three basis points inside its futures‑implied curve, confirming a 2–3 bps “greenium” AOFM.
Because Life cycle Economics overall captures all costs and benefits. It rescues options that look costly upfront yet dominate over thirty years.
Life Cycle Economics Hub Policy & market drivers
In summary three fresh signals push Australasian boards toward Life cycle Economics. First, green‑bond demand is rising. AOFM plans another A $150 billion issue year, including further green tranches AOFM. Second, the Investment Boost lets businesses expense 20 % of any new asset from 22 May 2025, lifting after‑tax IRRs Inland Revenue. Third, EU‑style taxonomy alignment is coming. UTS research warns that Australia must close taxonomy gaps to stay investible University of Technology Sydney. Consequently, investors reward projects that evidence long‑term value, penalising opaque ones. Lower public sector discount tables also matter: Treasury lists a 2.70 % real forward rate for 2038 cash flows The Treasury New ZealandThe Treasury New Zealand. Combined, these drivers make transparent, risk‑adjusted economics essential.
Practical frameworks
- LCC Calculator—web XLS with AU/NZ defaults; it auto‑plots NPV and IRR, then exports to CBAx.
- Payback‑curve chart—one‑click PNG shows cumulative cash under low, mid and high energy prices, mirroring Auckland’s LED case.
- Monte‑Carlo risk sheet—users set capex overrun, carbon price and rates; ten‑thousand trials return P10, P50, P90 outcomes consistent with Treasury guidance The Treasury New Zealand.
- Risk‑score dashboard—ISO 31000 matrix links trigger levels to the 2025 risk‑free curve, flagging red when NPV turns negative. Furthermore, each template carries EU‑taxonomy fields for cross‑border funding.
Q1. What is life-cycle economics?
A holistic cash-flow method that separates CAPEX and OPEX. Discounts them at today’s risk-free rates and tests uncertainty with Monte-Carlo simulations.
Q2. How do Monte-Carlo simulations improve cost certainty?
By running thousands of trials that vary interest rates, energy prices and cost overruns. They reveal P10–P90 payback ranges so boards can size contingencies confidently.
Q3. Which current AU/NZ incentives lift project IRR?
Australia’s 20 % Investment Boost (May 2025) and NZ’s accelerated depreciation rules. Both shorten cash-break-even by up to three years for qualifying green assets.
Explore our other cornerstone hubs
– Green Infrastructure and Strategies >>>
– Policy Funding Levers >>>
– Net Zero Districts Hub >>>
– Storm water ROI charts >>>
Expore our otherer posts

Automation Sustainable Urban Development
Cities That Learn: How Automation Sustainable Urban Development Brings Nature Back In short, Automation Sustainable Urban Development is no longer consequently a distant dream. Around

Living Walls Vertical Gardens
Living Walls Vertical Gardens: Where City Streets Breathe Again Living Walls Vertical Gardens are reshaping urban life across New Zealand and Australia. When you step

Sustainable Social Economic Models
From Company Towns to Green Cities: the Rise of Sustainable Social Economic Models Sustainable Social Economic Models are in fact, rewriting the urban playbook. To