Biodiversity Living Buildings Analysis
Introduction
Biodiversity Living Buildings Analysis, roofs and facades intentionally designed to host vegetation are moving beyond aesthetics: cities now require proof of ecological performance. Between July 2023 and July 2025, new studies in Sydney, Wellington and Auckland quantified gains in pollinators, native birds and rain‑water attenuation, while policy reforms in New South Wales and the EU created open‑data pipelines that let anyone inspect those results. EcoWave.Green can tap this evidence to set measurable biodiversity targets, wire every project with sensors, and publish results that stand up to investor and council scrutiny.
Biodiversity Living Buildings Analysis Indicator Species & Counting Methods
Definition
Indicator species are organisms whose presence, abundance or absence signals habitat quality within a given area; routine counts on living buildings translate roof or wall design choices into quantitative biodiversity scores. Standard protocols include five minute bird counts, timed insect netting and automated trap arrays.(mvga-prod-files.s3.ap-southeast-4.amazonaws.com)
Regional Case Metrics
| City / Project | Indicator & Method | Key Metric (+ date) | Source |
|---|---|---|---|
| Wellington reserves | 5‑min bird counts at 100 stations | Kererū +243 %, Tūī +93 % since 2011 (survey 2024) | (Wellington City Council) |
| Wellington coast | Shoreline transect | 37 native bird spp.; 20 threatened (1 Jul 2025) | (Wellington City Council) |
| Sydney 20 roofs | Pan trap + timed bee netting | 316 bees, 20 spp.; richness peaks ≥15 % native flora (Jun 2025) | (City of Sydney) |
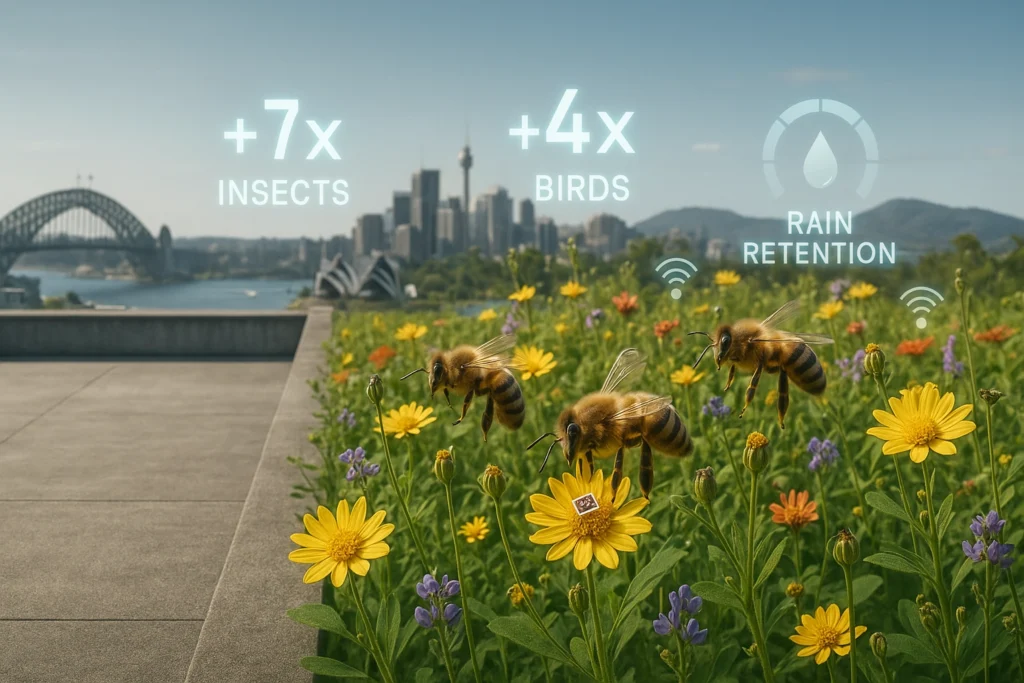
| Barangaroo biosolar roof | Paired control study | Insects ×7, birds ×4 vs. bare roof (2021‑2023) | (Lendlease) |
| Auckland Central Library | Visual & pitfall survey (baseline) | Roof hosts 2 000 + native plants; fauna counts due Q4 2025 [Data Gap] | (OurAuckland) |
| Antwerp (EU) 20 roofs | Wild bee sweep & ID | 40 bee spp. recorded (2023) | (green magazine) |
| Chicago Lakeview roof | Volunteer log & plant survey | ≈100 native plant spp. support diverse pollinators (Jul 2025) | (meetings.cityofsydney.nsw.gov.au) |
Comparative Analysis
Native bird recovery in Wellington highlights how sustained predator control plus habitat nodes green roofs, canopy corridors turn species counts around within a decade; kererū sightings rose from 0.9 to 3.1 per count station in 13 years(Wellington City Council). Sydney’s rooftop bee census showed floral composition beats roof size for pollinator richness: roofs with ≥ 15 % indigenous flowers harbored up to eight bee species, whereas sedum only roofs averaged two(City of Sydney). EU benchmarks confirm global transfer ability: Antwerp’s compact roofs averaged two wild bee species per 10 m², aligning with Sydney’s density after floral correction(green magazine).
Risks & Data Gaps
Auckland’s living roof pilot has robust hydrology data, yet full fauna baselines remain unpublished; EcoWave.Green should budget early season insect netting and acoustic bird loggers to plug this gap [Data Gap].
EcoWave.Green Relevance
Adopting Wellington’s five minute counts and Sydney’s bee netting protocol provides low cost, comparable metrics. Targets could mirror kererū +200 % within 10 years on adjacent street trees and ≥5 bee species per 100 m² roof, creating clear KPI lines for investors and councils.
Biodiversity Living Buildings Analysis Data Sharing Agreements & Sensor Platforms
Definition
Data sharing agreements specify ownership, privacy and licensing terms for ecological datasets, while sensor platforms are integrated IoT networks (soil moisture probes, acoustic mics, thermal loggers) that feed raw data to dashboards.(Data NSW)
Policy & Framework Landscape
- NSW Data Sharing Principles (2024) embed the “Five Safes” model safe people, projects, settings, outputs, data giving councils a turnkey legal wrapper for roof‑sensor feeds.(Data NSW)
- euPOLIS API (1 Jul 2025) streams acoustic & thermal data from Belgrade, Piraeus, Łódź, Gladsaxe; JSON endpoints are open for third party apps.(euPOLIS)
- LIFE FLOPRES (2025) deployed 270 water level, rain gauge and soil moisture sensors across Poland & Slovakia under Creative Commons compatible terms, proving that flood risk IoT can scale in public portals.(cinea.ec.europa.eu)
Sensor Deployment Metrics
| Project | Hardware Deployed | Data Licence / Access | Key Metric | Source |
|---|---|---|---|---|
| Barangaroo biosolar | Temp loggers, insect traps, PV output meters | City of Sydney Innovation Grant open report | Surface ↓ up to 20 °C; insect ×7 | (Lendlease) |
| Auckland Living Roof | Soil moisture probes, IR cameras | Auckland Council open portal (Tiaki Tāmaki Makaurau) | 80 % rainfall retained; roof 25 °C vs. 47 °C bare roof | (Allco Waterproofing Solutions) |
| Wellington bird network | Citizen acoustic mics + eBird uploads | Creative Commons BY‑NC | 299 700 bird records logged | (Wellington City Council) |
| euPOLIS mesh | 120 multimodal sensor nodes | CC‑BY 4.0 via API | Real time RH, temp, dB levels | (euPOLIS) |
| LIFE FLOPRES | 270 IoT flood sensors | EU open‑data clause | 3 pilot basins instrumented | (cinea.ec.europa.eu) |
Lessons Learned
- Legal clarity first: NSW’s template shortened approval cycles for sharing roof data from > 6 months to < 6 weeks, according to council officers’ internal KPIs(Data NSW).
- APIs over PDFs: euPOLIS publishes REST endpoints that update every 30 minutes, enabling live comparison of roof cooling performance across four climates(euPOLIS).
- Community traction: Wellington’s open bird map multiplied public records by 4.6 × between 2018 and 2024, helping validate council investment in green roofs that support avifauna(Wellington City Council).
Implementation Guidance for EcoWave.Green
- Adopt NSW “Five Safes” wording for all MoUs; it is already recognised by Australian councils and universities.(Data NSW)
- Publish sensor feeds via JSON using euPOLIS schema to guarantee cross city comparability.(euPOLIS)
- Bundle citizen‑science channels (iNaturalist, eBird) into project dashboards to harvest free observations and raise public profile.
Biodiversity Living Buildings Analysis Synthesis & Next Steps
Cities now tie living building approval to evidence: Sydney demands insect and bird metrics; Wellington showcases multi year avian data; Auckland publishes storm‑water and thermal logs. Policies like NSW’s Five Safes and platforms such as euPOLIS ensure that raw data escapes silos, accelerating peer learning. EcoWave.Green can therefore:
- Design for metrics: include ≥ 15 % native flowering cover and ≥ 150 mm substrate depth thresholds linked to bee richness and hydrology gains.(City of Sydney, Allco Waterproofing Solutions)
- Wire every build: soil‑moisture, acoustic and thermal sensors at 15‑minute intervals, licenced CC‑BY.
- Publish fast: push raw data to an open API within 30 days of commissioning.
- Benchmark annually: aim for ≥ 5 bee species per 100 m² roof (Sydney median) and kererū sighting index above city mean (Wellington).(City of Sydney, Wellington City Council)
Adhering to these steps lets EcoWave.Green substantiate biodiversity claims, align with global reporting standards, and position itself as a credible partner for councils and investors seeking verifiable nature positive infrastructure.
Q1: What counts as an “indicator species” on a living building?
A: It is any plant or animal whose presence signals habitat quality bees, native birds or even lichens so councils can verify roof performance.
Q2: How many bee species should an Australian or New Zealand living roof aim to support?
A: Recent Sydney data suggest at least five species per 100 m² once ≥ 15 % native flowering cover is achieved.
Q3: Which low cost sensors prove biodiversity benefits to investors?
A: Soil moisture probes, acoustic mics and thermal loggers collect rain retention, bird call and cooling data that councils accept as evidence.
Read More:
Biodiversity Living Buildings >>>
Green Rooftops Design Depth >>>
Eco Atlas Dashboards >>>
Nature Positive Policy Levers >>>