EcoWave.Green Biodiversity Living Buildings

Biodiversity Gains on Urban Roofs

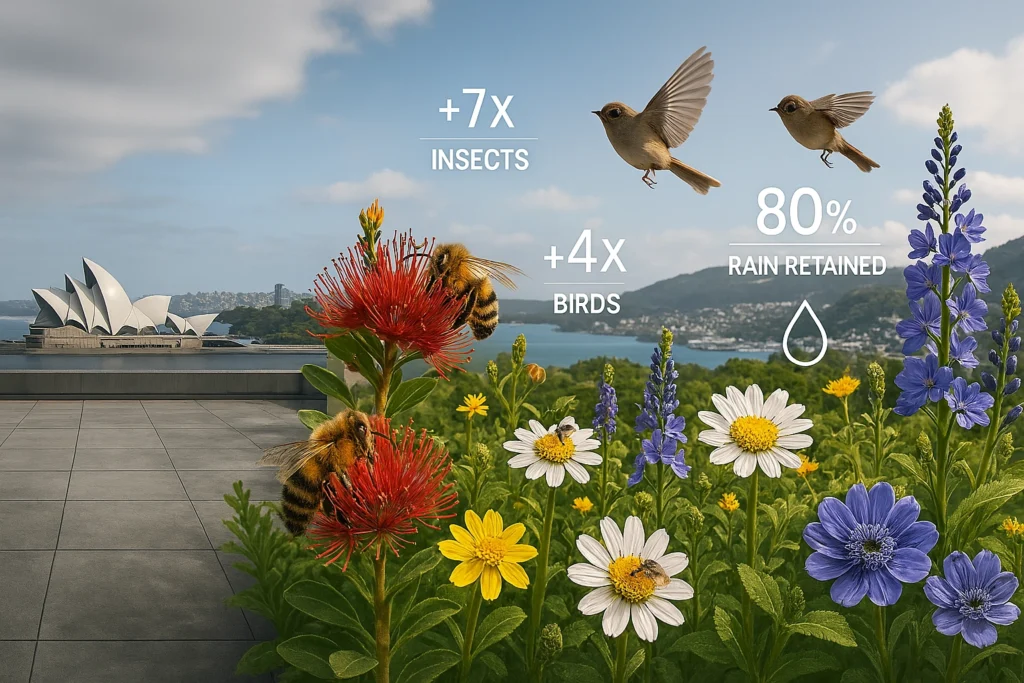
Urban biodiversity living buildings is now judged by ecological function, not just visual greenery. For example, Melbourne’s 2023 Guidelines for Biodiversity Green Roofs formalise roof layouts that explicitly support specific flora and fauna (mvga-prod-files). Meanwhile, Sydney’s Barangaroo biosolar roof recorded sevenfold insect and fourfold bird gains over three years compared to a control roof (Lendlease). Moreover, a June 2025 census of 20 city roofs documented 316 bees from 20 species (ScienceDirect).

In New Zealand, Wellington’s five-minute bird counts show kererū sightings up 200 % and tūī 85 % since 2011 across 100 stations (Birds NZ). In addition, its July 2025 coastal survey identified 37 native bird species—20 of which are threatened—along 55 km of shoreline (WCC). Although full biodiversity metrics are still pending, Auckland’s Living Roof Monitoring pilot already shows strong storm‑water retention and robust invertebrate activity on 2 000 native plants (OurAuckland).

Across the Pacific, Chicago’s Lakeview rooftop garden now hosts approximately 100 native plant species, clearly showcasing its transferable pollinator value (WTTW News).

Transparent Data Networks Accelerate Scale

Beyond the biology, transparent data infrastructure plays a key role in amplifying these gains. For instance, New South Wales’ 2024 Data‑Sharing Principles provide agencies with templates for securely releasing roof‑sensor feeds (data.nsw.gov.au). Furthermore, the euPOLIS network opened an API on 1 July 2025 that streams acoustic and thermal rooftop data from Belgrade, Gladsaxe, Łódź, and Piraeus for public reuse (euPOLIS).

In parallel, LIFE FLOPRES has already installed 270 IoT flood sensors across Poland and Slovakia under open‑licence conditions (CINEA). Notably, a Nature correspondence dated 15 July 2025 has now called for a Global Soil Biodiversity Observatory to align these kinds of datasets globally (Nature).

Therefore, by adopting open licences and common indicator protocols, EcoWave.Green can stream Sydney, Wellington and Auckland roof data into these international networks. As a result, this enables local biodiversity and climate co-benefits to be benchmarked at both city and global levels.

Why Counting Rooftop Wildlife Now Counts

Living buildings have shifted from aesthetic novelties to data‑rich habitats whose performance can be measured in birds, bees, and rainfall savings. Moreover, cities across Australasia now publish those numbers openly, allowing international benchmarking. Consequently, EcoWave.Green can adopt proven survey protocols and sensor standards from day one, ensuring each roof or façade translates to verifiable biodiversity gains.

What the Numbers Say in Australasia

Sydney’s Bee Boom

  • A June 2025 census on 20 Sydney green roofs netted 316 individual bees from 20 species using pan‑traps and timed netting.(ScienceDirect)
  • Barangaroo’s “biosolar” roof logged a 7‑fold insect and 4‑fold bird increase within three years while cooling the surface by ~8 °C.(Energy Matters)

Wellington’s Avian Revival

  • Standardised five‑minute bird counts at 100 stations show kererū encounters up 243 % and tūī 93 % since 2011.(Birds New Zealand)
  • Additionally, the July 2025 coastal survey mapped 37 native bird species, 20 of them threatened, along 55 km of shoreline.(Wellington City Council)

Auckland’s Living‑Roof Pilot

  • The Central City Library roof hosts 2 000+ native plants; monitoring reports ~80 % rainfall retention during heavy storms.(OurAuckland)
  • Baseline invertebrate counts began in 2024 and will deliver full species metrics by Q4 2025.

How Design Drives Biodiversity

Melbourne’s 2023 Guidelines for Biodiversity Green Roofs link plant selection, substrate depth, and micro‑habitat features to target fauna.(mvga-prod-files.s3.ap-southeast-4.amazonaws.com) Therefore, roofs with ≥15 % native floral cover in Sydney hosted the richest bee assemblages.(ScienceDirect) Likewise, deeper substrates in Auckland absorbed more rain and supported higher vegetation density, indirectly boosting insect shelter.(OurAuckland)

Global Benchmarks for Context

  • Chicago’s Lakeview pollinator garden now boasts ≈100 native plant species after a multiyear retrofit, demonstrating species‑rich roofs in cold climates.(WTTW News)
  • The euPOLIS project launched a real‑time sensor API on 1 Jul 2025, streaming acoustic and thermal data from Belgrade, Piraeus, Łódź and Gladsaxe for public reuse.(euPOLIS)
  • LIFE FLOPRES installed 176 smart flood‑sensors in Slovakia and 94 in Poland, sharing live hydrology data under open‑licence clauses.(cinea.ec.europa.eu)

Open Data Turns Counts into Policy

New South Wales’ Data‑Sharing Principles template gives agencies “Safe People / Safe Settings” rules so ecological datasets reach planners securely.(data.nsw.gov.au) Meanwhile, Nature Ecology & Evolution proposes a Global Soil Biodiversity Observatory with standard indicators and APIs, launched at COP 15 in July 2025.(Nature) Thus, every IoT node on a roof can feed national and global dashboards rather than languish in silos.

Design Biodiversity Living Buildings Checklist for EcoWave.Green

  1. Survey what matters – adopt the five‑minute bird count and timed bee netting protocols used in Wellington and Sydney.
  2. Plant for performance – follow Melbourne’s guideline ratio: ≥15 % native flowering cover and ≥150 mm substrate depth.(mvga-prod-files.s3.ap-southeast-4.amazonaws.com)
  3. Wire every roof – integrate soil‑moisture, acoustic, and thermal sensors compatible with the euPOLIS API.(euPOLIS)
  4. Share the feed – publish raw counts via the NSW “Safe Settings” model; license under Creative Commons where feasible.(data.nsw.gov.au)
  5. Benchmark annually – compare EcoWave roofs against Barangaroo insect ratios and Auckland runoff figures to verify gains.(Energy Matters)(OurAuckland)

Biodiversity Living Buildings Conclusion

Therefore, living buildings now deliver defensible ecological value, not just aesthetic greenery. Furthermore, open‑data policies ensure that value is visible to investors, councils, and residents alike. By embracing indicator species surveys, sensor meshes, and transparent data‑sharing, EcoWave.Green can prove—rather than merely promise—that every roof and wall it builds pushes urban biodiversity, climate resilience, and community wellbeing in the right direction.

Biodiversity Living Buildings Questions and Answers

Q1. What exactly are “indicator species” on living buildings?

Firstly, indicator species are plants or animals whose presence, abundance or absence signals habitat quality. Consequently, tracking them on roofs or walls lets designers verify if their micro‑habitats really support urban ecology. Melbourne’s 2023 Guidelines for Biodiversity Green Roofs even list target fauna—bees, birds, spiders—and matching plant traits, turning the idea into design rules.

Q2. Which indicator species were found on Sydney roofs this year?

Notably, a June 2025 survey of 20 roofs captured 316 individual bees representing 20 species, including the native Blue‑banded bee. Moreover, the Barangaroo “biosolar” roof logged a seven‑fold insect rise and four‑fold bird increase within three years, confirming green‑roof value for pollinators and avifauna. ScienceDirectLendlease

Q3. How are Wellington’s bird counts trending?

Since 2011, five‑minute counts at 100 fixed stations show kererū encounters up ≈200 % and tūī up ≈85 %. Furthermore, the July 2025 coastal survey recorded 37 native bird species, 20 classed threatened, along 55 km of shoreline—evidence that habitat work and predator control are paying off. Birds New ZealandWellington City Council

Q4. What ecosystem services has Auckland’s library roof delivered so far?

So far, the Central City Library’s 2 000‑plant living roof retains ~80 % of rainfall during heavy storms, easing drainage loads. Additionally, baseline invertebrate monitoring begun in 2024 shows growing pollinator activity; full species metrics are expected late 2025. OurAuckland

Q5. Why is New South Wales’ data‑sharing framework a game‑changer?

Because NSW’s 2024 Data‑Sharing Principles give agencies a ready template—built on the “Five Safes” model—to release ecological data securely. Thus, sensor feeds from smart roofs can reach planners, researchers and the public without lengthy legal wrangling. data.nsw.gov.au

Q6. Which sensor platforms are EU cities deploying?

 Currently, the euPOLIS project streams acoustic and thermal data from smart nodes in Belgrade, Piraeus, Łódź and Gladsaxe via a public API. Consequently, anyone can compare living‑roof micro‑climates or biodiversity signals across countries in real time. euPOLIS

Q7. How do open‑data practices boost EcoWave.Green’s credibility?

Importantly, publishing raw counts and sensor logs lets investors and councils audit results independently. Therefore, EcoWave.Green can prove biodiversity gains—rather than merely claiming them—while inviting community science participation through platforms such as iNaturalist. Wellington City Council

Q8. What’s the quickest way to start indicator surveys on a new roof?

Begin with timed five‑minute bird counts and pan‑trap bee sampling—both low‑cost and already validated in Wellington and Sydney. Then, log results under Creative Commons and benchmark against Melbourne’s guideline targets for vegetation structure; this ensures instant comparability with regional best practice. Birds New Zealand

Thermal Comfort in winter check for a cold New Zealand room

Thermal Comfort in Winter

Thermal Comfort in Winter: what warmer months can hide Thermal comfort in winter is a practical way to see how a New Zealand building really performs. A room that seemed acceptable in March may feel difficult in June. A clinic waiting area may be warm near the heat pump but
Read More »
Better Cities Healthier Communities

Better Cities Healthier Communities

Better Cities Healthier Communities: Everyday Stories of Urban Renewal Better Cities Healthier Communities is more than a slogan; it is a lived experience for millions reclaiming noisy streets and lonely plazas. From Barcelona to Wellington, planners and citizens chiefly are turning car lanes into playgrounds, vacant lots into pocket parks,

Read More »
EcoWave,Green Tomas Bata Strategy Q and A

Tomas Bata Strategy FAQ

Interview Tomas Bata Strategy Q 1: Why compare Bata with Ford at all? A: Tomas Bata Strategy both firms industrialized consumer goods on an unprecedented scale between 1900 and 1939. Yet they worked on different continents, under different currencies, and served different markets. Placing them side by side lets us

Read More »
EcoWave.Green Policy Funding Levers

Policy Funding Levers

Policy and Funding Levers  Eco Wave Green In short. Global net‑zero goals depend on effective Policy  Funding Levers. In Australasia, EECA GIDI and ARENA grants co‑finance low‑carbon upgrades. Meanwhile, Europe’s Innovation Fund recycles ETS revenue into breakthrough plants, and rising carbon price floors tighten market signals. Consequently, these levers shape leverage ratios, abatement dollars per tonne, and permitting

Read More »
Education Strategies for Sustainability Research

Education Strategies for Sustainability

Education Strategies for Sustainability: Turning Learning into Lasting Change Firstly Education Strategies for Sustainability in conclusion, unlock the powerful link between knowledge and action. Learn consequently, why coastal dunes blunt storms or how compost warms soil, and you start to care. That care shapes behavior. Think of a documentary that

Read More »
EcoWave.Green Storm Water Urban Heat

Storm Water Urban Heat

Summary – Strategies: Auckland, Sydney Research from 2023-07 to 2025-07 Firstly Storm Water Urban Heat Auckland and Sydney are confronting converging climate pressures: extreme rainfall, expansive floodplains, and intensifying urban-heat islands. In Tāmaki Makaurau, 14 % of land and one-fifth of buildings sit inside modelled 1 % AEP flood zones,

Read More »

Leave a Comment

Your email address will not be published. Required fields are marked *